

Tom Werner/DigitalVision via Getty Images
“High-High-Low” Closed-End Fund Report
Quantitative screens help to rapidly narrow down attractive candidates from the database of 500+ closed-end funds [CEFs] for further due diligence and investigation. The “High-High-Low” report was inspired by a member of CEF/ETF Income Laboratory, who wrote:
Stanford, you should do a follow up article on CEFs that distribute 8%+, have 90% or more coverage and trade under NAV. What does that look like in today’s world? How many funds are doing that? What are the Z scores? I think many investors would be interested who are pushing for higher yield to identify best in class of aggressive funds that are coming close to covering dividends. Allows people to reevaluate risk/reward.

Author
The “High-High-Low” report screens for the following three attributes that we would like to screen for:
- High distributions (>8%) (i.e., 8% or higher yields)
- High coverage (>90%) (i.e., 90% or better coverage)
- Low premium/discount value (<0%) (i.e., trading at a discount)
How is coverage calculated?
For the following fund houses, the latest trailing coverage numbers from the fund’s latest unaudited monthly estimates are used:
- PIMCO: trailing 6-month coverage
- BlackRock: trailing 3-month coverage
- Nuveen: trailing 3-month coverage
- Eaton Vance: trailing 3-month coverage
For the remaining funds, the coverage ratios are calculated using earnings data from their most recent annual/semi-annual reports. As these reports are released only twice a year, the coverage ratios will show more of a lag (of up to 6 months) compared to those fund families that release monthly earnings estimates.
I hope that these rankings of “high-high-low” CEFs will provide fertile grounds for further exploration and due diligence. As a reminder, these top lists are meant to be preliminary shortlists for further research, not meant to be the final analysis for a buy or sell decision.
Key to table headings:
P/D = premium/discount
Z = 1-year z-score
Cov = coverage
1Y NAV = 1-year NAV total return
Lev = leverage
BE = baseline expense
Data were taken from the close of July 26th, 2024.
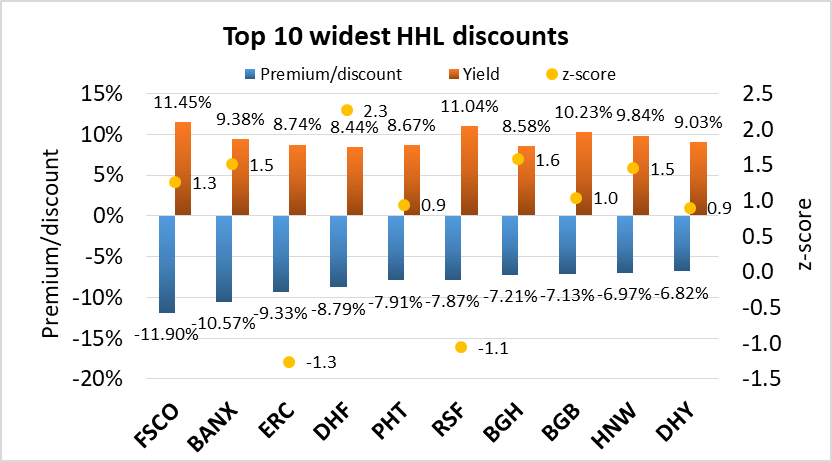
1. Top 10 widest “high-high-low” discounts
The following data show the 10 CEFs with the widest discounts, yield >8% and coverage >90%. Z-scores, leverage and baseline expenses are shown for comparison.
| Fund | Ticker | Category | P/D | Yield | Z | Cov | 1Y NAV | Lev | BE |
| FS Credit Opportunities Corp. | (FSCO) | Multisector Income | -11.90% | 11.45% | 1.3 | 101% | 19.5% | 17% | 4.62% |
| ArrowMark Financial Corp | (BANX) | Sector Equity | -10.57% | 9.38% | 1.5 | 155% | 12.9% | 23% | 4.11% |
| Allspring Multi-Sec Inc | (ERC) | Limited Duration | -9.33% | 8.74% | -1.3 | 91% | 7.9% | 30% | 0.96% |
| BNY Mellon High Yield Strategies Fund | (DHF) | High Yield | -8.79% | 8.44% | 2.3 | 106% | 13.8% | 28% | 1.00% |
| Pioneer High Income | (PHT) | High Yield | -7.91% | 8.67% | 0.9 | 112% | 15.9% | 31% | 1.12% |
| RiverNorth Capital and Inc Fund | (RSF) | High Yield | -7.87% | 11.04% | -1.1 | 138% | 9.6% | 58% | 8.84% |
| Barings Global Short Duration High Yield | (BGH) | High Yield | -7.21% | 8.58% | 1.6 | 111% | 18.3% | 26% | 1.88% |
| Blackstone Strategic Credit 2027 term | (BGB) | Senior Loans | -7.13% | 10.23% | 1.0 | 98% | 12.9% | 36% | 2.58% |
| Pioneer Diversified High Income | (HNW) | High Yield | -6.97% | 9.84% | 1.5 | 123% | 16.8% | 28% | 1.82% |
| Credit Suisse High Yield Bond Fund | (DHY) | High Yield | -6.82% | 9.03% | 0.9 | 96% | 13.8% | 27% | 1.44% |
Income Lab
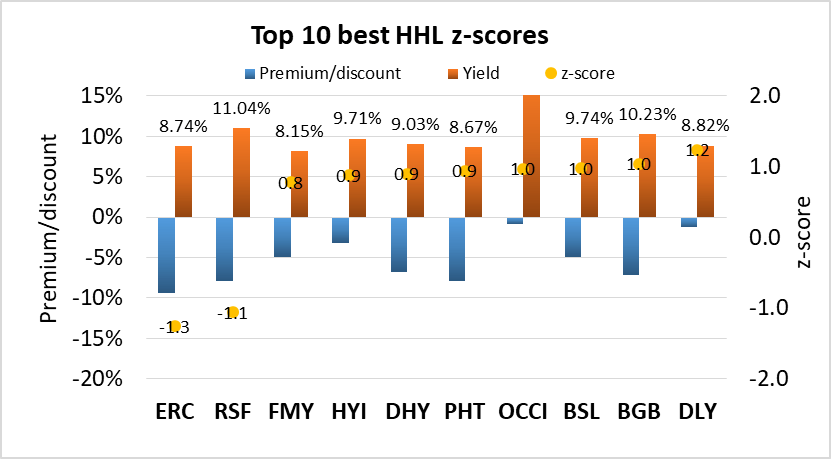
2. Top 10 lowest “high-high-low” z-scores
The following data show the 10 CEFs with the lowest 1-year z-scores, yield >8%, coverage >90% and premium/discount <0%. The more negative the z-score, the cheaper the fund is relative to its recent average discount. Leverage and baseline expense are shown for comparison.
| Fund | Ticker | Category | Z | P/D | Yield | Cov | 1Y NAV | Lev | BE |
| Allspring Multi-Sec Inc | (ERC) | Limited Duration | -1.3 | -9.33% | 8.74% | 91% | 7.9% | 30% | 0.96% |
| RiverNorth Capital and Inc Fund | (RSF) | High Yield | -1.1 | -7.87% | 11.04% | 138% | 9.6% | 58% | 8.84% |
| First Trust Mortgage Income | (FMY) | Investment Grade | 0.8 | -4.93% | 8.15% | 96% | 10.4% | 7% | 1.36% |
| Western Asset High Yield Defined Opps | (HYI) | High Yield | 0.9 | -3.23% | 9.71% | 94% | 6.4% | 0% | 0.95% |
| Credit Suisse High Yield Bond Fund | (DHY) | High Yield | 0.9 | -6.82% | 9.03% | 96% | 13.8% | 27% | 1.44% |
| Pioneer High Income( | (PHT) | High Yield | 0.9 | -7.91% | 8.67% | 112% | 15.9% | 31% | 1.12% |
| OFS Credit Company Inc | (OCCI) | Senior Loans | 1.0 | -0.83% | 17.61% | 90% | 11.9% | 35% | 9.05% |
| Blackstone Senior Floating Rt 2027 term | (BSL) | Senior Loans | 1.0 | -4.95% | 9.74% | 101% | 13.2% | 32% | 1.93% |
| Blackstone Strategic Credit 2027 term | (BGB) | Senior Loans | 1.0 | -7.13% | 10.23% | 98% | 12.9% | 36% | 2.58% |
| DoubleLine Yield Opportunities Fund | (DLY) | Multisector Income | 1.2 | -1.24% | 8.82% | 93% | 15.7% | 20% | 1.87% |
Income Lab
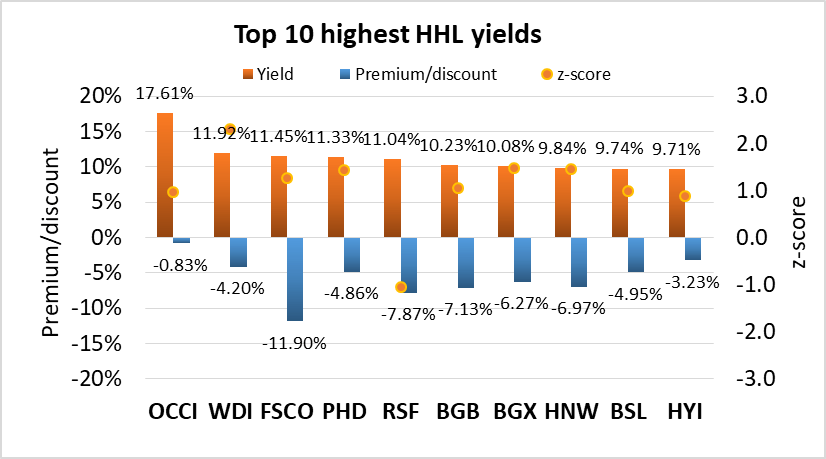
3. Top 20 highest “high-high-low” yields
The following data show the 20 CEFs with the highest yields, coverage >90% and premium/discount <0%. However, it is important to note that higher yields can sometimes be associated with higher risk, such as through leverage or investment in risky assets. z-scores, leverage, and baseline expense are shown for comparison.
| Fund | Ticker | Category | Yield | P/D | Z | Cov | 1Y NAV | Lev | BE |
| OFS Credit Company Inc | (OCCI) | Senior Loans | 17.61% | -0.83% | 1.0 | 90% | 11.9% | 35% | 9.05% |
| Western Asset Diversified Inc Fund | (WDI) | Multisector Income | 11.92% | -4.20% | 2.3 | 98% | 14.3% | 32% | 1.81% |
| FS Credit Opportunities Corp. | (FSCO) | Multisector Income | 11.45% | -11.90% | 1.3 | 101% | 19.5% | 17% | 4.62% |
| Pioneer Floating Rate Fund | (PHD) | Senior Loans | 11.33% | -4.86% | 1.4 | 107% | 15.0% | 32% | 1.40% |
| RiverNorth Capital and Inc Fund | (RSF) | High Yield | 11.04% | -7.87% | -1.1 | 138% | 9.6% | 58% | 8.84% |
| Blackstone Strategic Credit 2027 term | (BGB) | Senior Loans | 10.23% | -7.13% | 1.0 | 98% | 12.9% | 36% | 2.58% |
| Blackstone Long-Short Credit Income | (BGX) | Senior Loans | 10.08% | -6.27% | 1.5 | 105% | 13.2% | 31% | 2.20% |
| Pioneer Diversified High Income | (HNW) | High Yield | 9.84% | -6.97% | 1.5 | 123% | 16.8% | 28% | 1.82% |
| Blackstone Senior Floating Rt 2027 term | Senior Loans | 9.74% | -4.95% | 1.0 | 101% | 13.2% | 32% | 1.93% | |
| Western Asset High Yield Defined Opps | (HYI) | High Yield | 9.71% | -3.23% | 0.9 | 94% | 6.4% | 0% | 0.95% |
| ArrowMark Financial Corp | (BANX) | Sector Equity | 9.38% | -10.57% | 1.5 | 155% | 12.9% | 23% | 4.11% |
| Credit Suisse High Yield Bond Fund | (DHY) | High Yield | 9.03% | -6.82% | 0.9 | 96% | 13.8% | 27% | 1.44% |
| DoubleLine Yield Opportunities Fund | (DLY) | Multisector Income | 8.82% | -1.24% | 1.2 | 93% | 15.7% | 20% | 1.87% |
| Allspring Multi-Sec Inc | (ERC) | Limited Duration | 8.74% | -9.33% | -1.3 | 91% | 7.9% | 30% | 0.96% |
| Pioneer High Income | (PHT) | High Yield | 8.67% | -7.91% | 0.9 | 112% | 15.9% | 31% | 1.12% |
| Barings Global Short Duration High Yield | (BGH) | High Yield | 8.58% | -7.21% | 1.6 | 111% | 18.3% | 26% | 1.88% |
| BNY Mellon High Yield Strategies Fund | (DHF) | High Yield | 8.44% | -8.79% | 2.3 | 106% | 13.8% | 28% | 1.00% |
| First Trust Mortgage Income | (FMY) | Investment Grade | 8.15% | -4.93% | 0.8 | 96% | 10.4% | 7% | 1.36% |
Income Lab

Income Lab
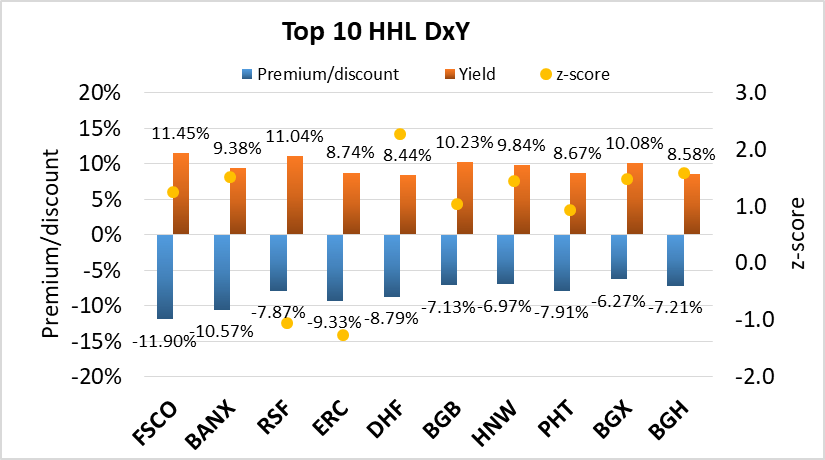
4. Top 10 best combination of “high-high-low” yield and discount
Buying a CEF with both a high yield and discount not only gives you the opportunity to capitalize from discount contraction, but you also get “free” alpha every time the distribution is paid out. This is because paying out a distribution is effectively the same as liquidating the fund at NAV and returning the capital to the unitholders. Only funds with >8% yield, >90% coverage and <0% premium/discount are considered.
| Fund | Ticker | Category | P/D | Yield | Z | DxY | Cov | 1Y NAV | Lev | BE |
| FS Credit Opportunities Corp. | (FSCO) | Multisector Income | -11.90% | 11.45% | 1.3 | -1.4 | 101% | 19.5% | 17% | 4.62% |
| ArrowMark Financial Corp | (BANX) | Sector Equity | -10.57% | 9.38% | 1.5 | -1.0 | 155% | 12.9% | 23% | 4.11% |
| RiverNorth Capital and Inc Fund | (RSF) | High Yield | -7.87% | 11.04% | -1.1 | -0.9 | 138% | 9.6% | 58% | 8.84% |
| Allspring Multi-Sec Inc | (ERC) | Limited Duration | -9.33% | 8.74% | -1.3 | -0.8 | 91% | 7.9% | 30% | 0.96% |
| BNY Mellon High Yield Strategies Fund | (DHF) | High Yield | -8.79% | 8.44% | 2.3 | -0.7 | 106% | 13.8% | 28% | 1.00% |
| Blackstone Strategic Credit 2027 term | (BGB) | Senior Loans | -7.13% | 10.23% | 1.0 | -0.7 | 98% | 12.9% | 36% | 2.58% |
| Pioneer Diversified High Income | (HNW) | High Yield | -6.97% | 9.84% | 1.5 | -0.7 | 123% | 16.8% | 28% | 1.82% |
| Pioneer High Income | (PHT) | High Yield | -7.91% | 8.67% | 0.9 | -0.7 | 112% | 15.9% | 31% | 1.12% |
| Blackstone Long-Short Credit Income | (BGX) | Senior Loans | -6.27% | 10.08% | 1.5 | -0.6 | 105% | 13.2% | 31% | 2.20% |
| Barings Global Short Duration High Yield | (BGH) | High Yield | -7.21% | 8.58% | 1.6 | -0.6 | 111% | 18.3% | 26% | 1.88% |
Income Lab
5. Top 10 best combination of “high-high-low” yield, discount and z-score
This metric takes into account all three factors of yield, discount and z-score. The composite metric simply multiplies the three quantities together, which reveals funds that are undervalued on both an absolute and relative basis. A screen is applied to only include CEFs with a negative one-year z-score. Only funds with >8% yield, >90% coverage and <0% premium/discount are considered. (Only 2 funds fit these criteria this month)
| Fund | CEF | Category | P/D | Yield | Z | DxYxZ | Cov | 1Y NAV | Lev | BE |
| Allspring Multi-Sec Inc | (ERC) | Limited Duration | -9.33% | 8.74% | -1.3 | 1.0 | 91% | 7.9% | 30% | 0.96% |
| RiverNorth Capital and Inc Fund | (RSF) | High Yield | -7.87% | 11.04% | -1.1 | 0.9 | 138% | 9.6% | 58% | 8.84% |

Income Lab
Strategy Statement
Our goal aims to provide consistent income with enhanced total returns. Our CEF rotation strategy includes trading between CEFs to exploit fluctuations in valuations. This is because CEF prices are inefficient, with investors often overreacting to both the upside or downside, or being unaware of upcoming corporate actions. This could help capture alpha from CEFs for the nimble investor.
Remember, it’s really easy to put together a high-yielding CEF portfolio, but to do so profitably is another matter! Our experience has been that it is very possible to earn profitable returns in CEFs. While there are numerous opportunities in the closed-end fund sector, it is essential to remain vigilant of the associated risks. Blindly chasing yield is not a prudent strategy.