

primeimages/E+ via Getty Images
Dear Investor:
The Sound Shore Fund Investor Class (SSHFX) and Institutional Class (SSHVX) declined 3.45% and 3.43%, respectively, in the first quarter of 2026, trailing the Russell 1000 Value Index (Russell Value) which advanced 2.10%, and ahead of the Standard & Poor’s 500 Index (S&P 500) which declined 4.33%. The three-year annualized gains for SSHFX of 17.45% and for SSHVX of 17.68% were ahead of the Russell Value’s 14.31% and behind the S&P 500’s 18.32%. As long-term investors, we highlight that Sound Shore’s 35 year annualized returns of 10.43% and 10.69%, for SSHFX and SSHVX, respectively, as of March 31, 2026, were ahead of the Russell Value at 10.05% and compared favorably to the S&P 500 at 10.65%.
We are required by FINRA to say that: Performance data quoted represents past performance and is no guarantee of future results. Current performance may be lower or higher than the performance data quoted. Investment return and principal value will fluctuate so that an investor’s shares, when redeemed, may be worth more or less than their original cost. For the most recent month-end performance, please visit the Fund’s website at Sound Shore Fund.
After a strong end to 2025 (and the last 3 years, for that matter) US equity markets endured their worst opening quarter since 2022, with the S&P 500 falling 4.33% as geopolitical shocks and shifting sector dynamics took hold. The Iran war, surging oil prices and artificial intelligence (AI) disruption all dominated the headlines. These triggered a sharp rotation out of high-flying technology and AI leaders, while the energy sector surged on the commodity spike.
In recent years, quarterly shifts in market sentiment have reflected an evolving economic landscape and a flood of capital chasing short-term trading strategies. While this phenomenon often increases tracking error against the Russell Value and S&P 500 indices, we view the volatility as a key source of opportunity. More on that later. Our approach remains disciplined, prioritizing both valuation and the fundamental sustainability of the businesses and industries in which we invest. Sound Shore’s nearly five decades of long-term investing has proven that sticking to our investment discipline over full market cycles has been critical to our methodically taking advantage of these opportunistic and often volatile periods.
One of the narratives that drove debate and performance this quarter was the emergence of AI as a potential threat to information technology systems and software. A number of our tech investments were detractors for the quarter as a result. Qualcomm, Check Point, and Kyndryl sold off as the market worried about long-term impacts. Our process has always incorporated a good dose of humility as we assess how to differentiate the signal from the noise, and we will continue to monitor changes in end markets. We often see this lack of differentiation during periods of high volatility, where companies within the same sector move in lockstep regardless of their unique strengths and the opportunity remains to find those companies that are adapting well.
Leading semiconductor supplier Qualcomm (QCOM) is one example that was down with the sector. Long known for its mobile chip technology, there is short-term concern that the surge in memory prices will slow the cell phone market. And while this segment is maturing, Qualcomm is rapidly diversifying its business as its robust developer tools facilitate AI functionality in new markets and is driving adoption of QCOM chips. Meanwhile, the company is growing in diverse end markets such as automotive, internet of things and data centers. With its profitable mobile and licensing businesses and a strong balance sheet, we believe Qualcomm has the strategic flexibility to execute on the AI opportunity ahead.
Away from technology, concern over higher oil prices rippled through the market. Media and entertainment leader Disney and domestic carrier Southwest Airlines both gave back a portion of their prior gains as fears of a protracted war impacted consumer discretionary and travel related names. Both companies have very strong balance sheets and are benefitting from multiyear restructurings that are driving improved earnings and returns on capital. They remain full positions.
On the positive front, and in contrast to the above, energy was far and away the best performing sector for the period. Surging oil and gas prices drove holdings Coterra Energy, EQT and BP higher, each returning close to 20% or more. Our process leads us to sustainable businesses with low-cost reserves and fortress-like balance sheets. These are critical attributes in today’s volatile world and, we believe, make these businesses even more valuable. The Iran war and its impact on oil prices will be in focus; however, we continue to find value in these businesses on normalized long-term cash flow.
A bright spot in the tech space was our holding in Marvell Technology. The company designs custom chips that are both flexible and efficient, a competitive advantage we believe will help Marvell take market share and grow rapidly over the next few years. While many debated whether management could effectively scale up the business and compete, we were able to purchase the stock when it was trading at 10 times our estimate of long-term earnings power. Marvell’s exposure to data centers stems from a robust networking and optical business—essentially the “plumbing” of AI infrastructure. Additionally, its emerging custom silicon (ASIC) division co-develops tailored chips for “hyperscalers” like Amazon and Google to optimize performance and power efficiency for specific AI workloads. We believe this business will double earnings over the next three years.
We have talked in our last two annual letters about how we view and manage technological change and volatility. During the low-interest rate environment of 2015-2019, stock correlations were high, bond proxies did well, and our returns were closer to the Russell Value than they had been since our inception. Tracking error measures this drift – the extent to which a manager’s returns “track” the performance of a benchmark. Although not a focus of ours, many investment consultants use this metric to understand how a particular strategy may perform relative to a benchmark. As you can see in the chart below, Sound Shore’s tracking error was lowest during that period.
SOUND SHORE TRACKING ERROR vs RUSSELL 1000 VALUE INDEX
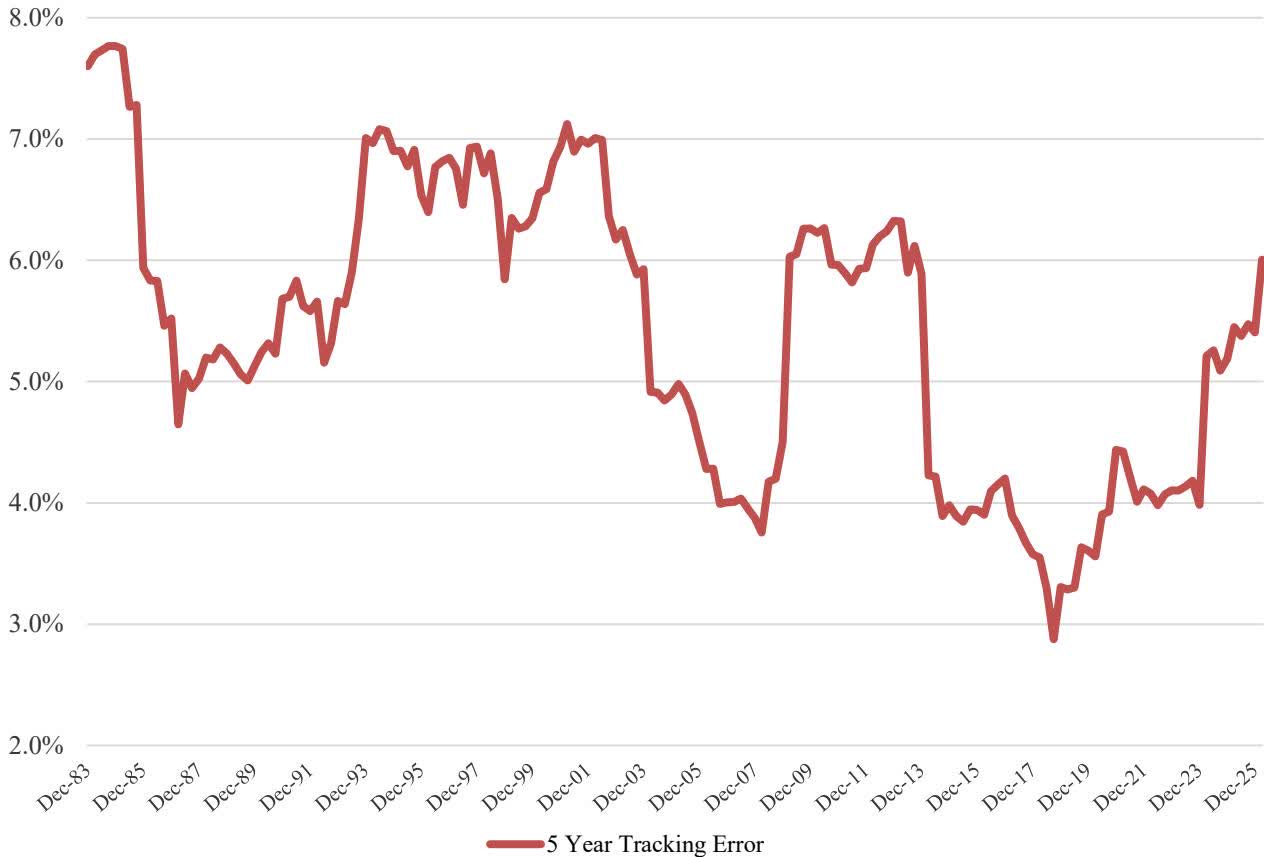
Over the last five years, in contrast to the 2015–2019 timeframe, we’ve had higher interest rates, increased market volatility, lower stock correlations, and occasionally extreme industry swings, as seen in the first quarter of 2026. During that time, Sound Shore’s tracking error has risen sharply, reflecting our increased ability to differentiate the portfolio through active stock selection. We expect our tracking error to revert toward long-term trends of 5%-8%, as seen this quarter. This shift is a positive development that should provide greater opportunity for our focused stock-picking strategy. We often say you can’t beat the index if you are the index, so we are with Charlie Munger on this one:
“The idea of ‘tracking error’ is a very silly idea for a long-term investor. If you have a group of wonderful businesses, who cares if they perform differently than the S&P 500 in any given year?”
– Charlie Munger (Late Vice-Chairman of Berkshire Hathaway)
In short, the willingness to look different from the index is fundamental to our process (even when it makes you look a little silly) and critically important in order to drive long-term value. This quarter provided another example of a market regime where ‘narrative-driven’ volatility leads to extreme, short-term industry and sector swings. These moves are often amplified by quantitative, thematic, and trend-following strategies that prioritize momentum over fundamentals. We believe it ultimately creates fertile ground for our disciplined approach, as evidenced by our results over the last five years. Our portfolio is well positioned for trends that are likely to emerge and will create long-term value for our investors.
Currently, our portfolio is attractively valued at an average twelve-month forward P/E ratio of 12.8 times versus the S&P 500 of 19.4 times and the Russell 1000 Value of 16.0 times. We appreciate your investment alongside ours and encourage you to reach out with any questions or comments.
Sincerely,
SOUND SHORE MANAGEMENT, INC.
Editor’s Note: The summary bullets for this article were chosen by Seeking Alpha editors.