phongphan5922
Fund Characteristics
| P/V Ratio |
Low-60s% |
|
Cash |
19.4% |
|
# of Holdings |
18 |
All data as of June 30, 2024
| Annualized Total Return | |||||||
| 2Q | YTD | 1 Year | 3 Year | 5 Year | 10 Year | Since Inception | |
| (%) | (%) | (%) | (%) | (%) | (%) | (%) | |
| Partners Fund | -6.31 | -0.13 | 5.89 | -1.51 | 6.61 | 3.14 | 9.26 |
| S&P 500 | 4.28 | 15.29 | 24.56 | 10.01 | 15.05 | 12.86 | 10.54 |
| Russell 1000 Value | -2.17 | 6.62 | 13.06 | 5.52 | 9.01 | 8.23 | 9.67 |
* Inception date 4/8/1987.
|
Returns reflect reinvested capital gains and dividends, but not the deduction of taxes an investor would pay on distributions or share redemptions. Performance data quoted represents past performance. Past performance does not guarantee future results. The investment return and principal value of an investment will fluctuate so that an investor’s shares, when redeemed, may be worth more or less than their original cost. The current performance of the Fund may be lower or higher than the performance quoted. Performance data current to the most recent month end may be obtained by visiting Value Investors Since 1975 | Southeastern Asset Management. The prospectus expense ratio before waivers is 1.05%. The Partners Fund’s expense ratio is subject to a contractual fee waiver to the extent the Fund’s normal operating expenses (excluding interest, taxes, brokerage commissions and extraordinary expenses) exceed 0.79% of average net assets per year. This agreement is in effect through at least April 30, 2025, and may not be terminated before that date without Board approval. |
We have bad news and good news. The bad news is that the Longleaf Partners Fund declined -6.31% in the second quarter, compared to the S&P 500 (SP500) and Russell 1000 Value, which returned 4.28% and -2.17%. In the quarter, we didn’t have enough significant winners, and more 10%+ decliners led to disappointing relative performance. Additionally, with the market hitting new highs regularly, we ended the quarter with a higher-than-normal 19% cash position. The good news is that our stock price declines were overreactions, resulting in our aggregate value per share performance outpacing stock price performance in the quarter. We own great companies that are on offense. It was encouraging to see large stock price moves in our favor since quarter end as of the posting of this letter. It has also been nice to see some overvalued market favorites moving in the opposite direction. We are excited about the future of the portfolio and in position to achieve our goal of double-digit returns this year and beyond.
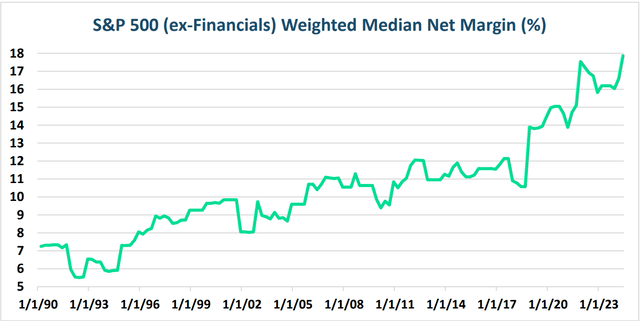
It is important to consider this chart:
For years, Warren Buffett, Jeremy Grantham and others have asserted that corporate margins as defined above would struggle to permanently break out of their historical high single to low double-digit range, which had also held for many years before our chart above begins in 1990. Yet, we are still several years into margins continuing to rise, which has significant valuation implications, particularly with high price-to-earnings (P/E) ratios. The focus tends to be on the high P/E ratios themselves, rather than the risk posed by elevated margins. If we analyze “normal” margins against gross domestic product (GDP), as Buffett might, or against S&P 500 revenues, as Grantham might, the current margins are unprecedented.
While the S&P 500 is trading at over 20 times potentially peak free cash flow (FCF), our individual investments are trading closer to 10 times FCF on margins that can improve. This positions our investments for growth even in tougher economic times, especially on a relative basis. If the S&P 500 ex-financials margin reverts to 15% (still an all-time high before the late 2010s) and trades at its long-run average P/E multiple of 16-17x (similar to non-mega-cap-growth-stocks globally today), this would imply a decline of over 30% in the next year. Conversely, if our portfolio’s earnings power (which we believe is underpinned by many things within our investees’ control) materializes into 2025 and trades at a low-teens multiple (assuming a discount to the market multiple because these are boring value stocks, but this could prove conservative), this would be an increase above our inflation plus 10% target. This exercise underscores the importance of stock picking for long-term success and the margin of safety in the portfolio today.
After doing both videos and letters for over two years, we have decided to go back to letters only. There was not enough differentiation in content between the two formats. Plus, we express ourselves better in writing. Another factor in our decision is that in-person visits have become more accepted again as the COVID era has waned, further reducing the need for videos. We will continue with our P/V Podcasts and look forward to sharing more content in that format.
Contribution To Return As Of June 30, 2024
2Q Top Five
|
Company Name |
Total Return (%) |
Contribution to Return (%) |
Portfolio Weight (%) |
|
FedEx Corporation (FDX) |
4 |
0.32 |
7.1 |
|
CNX Resources Corporation (CNX) |
2 |
0.17 |
5.8 |
|
RTX Corporation (RTX) |
4 |
0.17 |
3.5 |
|
Fidelity National Information Services, Inc. (FIS) |
2 |
0.10 |
5.5 |
|
Kellanova (K) |
2 |
0.08 |
5.5 |
2Q Bottom Five
|
Company Name |
Total Return (%) |
Contribution to Return (%) |
Portfolio Weight (%) |
|
Bio-Rad Laboratories, Inc. (BIO) |
-21 |
-1.04 |
4.2 |
|
CNH Industrial N.V. (CNH) |
-19 |
-1.04 |
4.7 |
|
Mattel, Inc. (MAT) |
-18 |
-0.98 |
4.8 |
|
IAC Inc. (IAC) |
-12 |
-0.68 |
5.4 |
|
PVH Corp. (PVH) |
-25 |
-0.65 |
3.6 |
FedEx Corporation: Global logistics company FedEx was the top contributor for the quarter. Late in the quarter, FedEx reported strong fiscal year results, highlighting a year of strong cost management in a challenging revenue environment. Earnings per share (EPS) increased by 19%, and reduced capital expenditures narrowed the gap between EPS and FCF per share. With the increase in FCF, the company has become a significant share repurchaser, which is a welcome change. The company also announced a strategic review of their Freight segment. Our appraisal has long accounted for the underappreciated value in FedEx’s less-than-truckload operations. A potential spin-off or sale could unlock substantial value, as comparable companies like Old Dominion Freight Line, Inc. (ODFL) trade at significantly higher multiples on revenue, cash flow, and earnings than those applied to FedEx Freight by the market and our appraisal today.
Bio-Rad Laboratories: Life sciences company Bio-Rad was the top detractor in the quarter. The company was one of our new investments last year, and so far, we have been early on our expectations for their life sciences business to return to more normal pre-COVID growth trends. We still believe that growth tailwinds are delayed, not derailed, and there have been no new material threats to Bio-Rad’s competitive position since we established our position last year. We are encouraged by the company’s use of a strong balance sheet to repurchase shares opportunistically. Current margins are below peer levels, suggesting potential for improvement, thereby further increasing FCF per share. The market also continues to undervalue their multi-billion-dollar stake in Sartorius Aktiengesellschaft (OTCPK:SARTF). We anticipate Bio-Rad will return to solid growth. Many of its peers are valued as if this growth is already occurring, even in this tough industry environment. While we can’t predict the exact timing, we believe this recovery will happen sooner than the market expects.
CNH Industrial: Agricultural machinery company CNH Industrial was a detractor in the quarter for two main reasons. First, the global ag equipment market went into the year depressed yet has still underperformed expectations, driven by weaker commodity prices and higher interest rates. Second, CEO Scott Wine’s departure, for personal reasons, has created a temporary management transition headwind. Despite these challenges, we remain optimistic about CNH’s long-term prospects. It is a high-quality business with pricing power in a consolidating market. Its equipment and precision technology are essential for increasing farm productivity and meeting global food demand amidst constrained land and labor inputs. CNH is executing well, gaining market share, and improving underlying margins. We also believe that the largest holder of CNH, our highly aligned partners at Exor N.V. (OTCPK:EXXRF) (which is a holding in our Global and International strategies), will continue the company along its path of FCF per share growth and increased focus on its core business. CNH is undervalued at 7 times earnings and is committed to returning 100% of FCF to shareholders through dividends and buybacks.
Mattel: Global toy and media company Mattel detracted for the quarter. The company reported what we viewed as solid quarterly results and an affirmation of 2024 guidance. We were particularly encouraged by their decision to increase their share repurchase program, which positions them well for FCF per share growth. As the quarter went on, however, the market focused on weaker consumer purchasing trends impacting Mattel and its peers. The market also seems to have moved past the success of last year’s Barbie movie, but we believe there is significant upside from media and entertainment revenue streams that are not yet reflected in today’s earnings expectations.
Portfolio Activity
We had one exit in the quarter, Liberty Broadband Corporation (LBRDK), which we had owned since 2021. Ultimately, we misjudged the business quality, underestimating competition from fiber and wireless broadband providers. These pressures forced Charter Communications, Inc. (CHTR) (of which Liberty Broadband owns 26%) to adjust its capital expenditures significantly, while calling into question the business’s pricing power. While we still believe Liberty Media are great partners, their ability to make immediate, impactful changes on this specific investment is limited in the near term. We did not make any new additions to the portfolio this quarter. However, we have identified some promising opportunities on which we are close and hope to share with you as we move into the second half of the year.
Outlook
Despite disappointing short-term absolute returns in the quarter, the businesses we own made progress on the metrics that matter most. We are positioned well for the rest of this year. The positive stock price moves for our holdings since quarter end are good, early signs on this front. The valuation gap between the broader market and our portfolio is at a uniquely high level, reinforcing our confidence. Our holdings consist of competitively entrenched businesses with robust balance sheets and proactive management teams focused on growing and recognizing value per share. The Fund ended the quarter with a price-to-value ratio in the low-60s%. We have several prospective investments in our on-deck list that can reduce the cash balance back to a more normal range without compromising our investment discipline. We are confident that our portfolio is well positioned for future absolute returns and relative outperformance across various market conditions. Thank you for your continued support and investment.
|
Disclosures Before investing in any Longleaf Partners Fund, you should carefully consider the Fund’s investment objectives, risks, charges, and expenses. For a current Prospectus and Summary Prospectus, which contain this and other important information, visit Longleaf Partners Fund. Please read the Prospectus and Summary Prospectus carefully before investing. Risks The Longleaf Partners Fund is subject to stock market risk, meaning stocks in the Fund may fluctuate in response to developments at individual companies or due to general market and economic conditions. Also, because the Fund generally invests in 15 to 25 companies, share value could fluctuate more than if a greater number of securities were held. Mid-cap stocks held by the Fund may be more volatile than those of larger companies. The S&P 500 Index is an index of 500 stocks chosen for market size, liquidity and industry grouping, among other factors. The S&P is designed to be a leading indicator of U.S. equities and is meant to reflect the risk/return characteristics of the large cap universe. S&P 500 Value Index constituents are drawn from the S&P 500 and are based on three factors: the ratios of book value, earnings, and sales to price. An index is unmanaged, does not reflect the deduction of fees or expenses, and cannot be invested in directly. The Russell 1000 Index measures the performance of the 1,000 largest companies in the Russell 3000 Index, which represents approximately 90% of the total market capitalization of the Russell 3000 Index. The Russell 1000 Value index is drawn from the constituents of the Russell 1000 based on book-to-price (B/P) ratio. An index is unmanaged, does not reflect the deduction of fees or expenses, and cannot be invested in directly. P/V (“price to value”) is a calculation that compares the prices of the stocks in a portfolio to Southeastern’s appraisal of their intrinsic values. The ratio represents a single data point about a Fund and should not be construed as something more. P/V does not guarantee future results, and we caution investors not to give this calculation undue weight. “Margin of Safety” is a reference to the difference between a stock’s market price and Southeastern’s calculated appraisal value. It is not a guarantee of investment performance or returns. Free Cash Flow (FCF) is a measure of a company’s ability to generate the cash flow necessary to maintain operations. Generally, it is calculated as operating cash flow minus capital expenditures. Price / Earnings (P/E) is the ratio of a company’s share price compared to its earnings per share. Gross Domestic Product (GDP) is the final value of the goods and services produced within the geographic boundaries of a country during a specified period of time. As of June 30, 2024, the top ten holdings for the Longleaf Partners Fund: FedEx, 7.1%; Affiliated Managers Group, 6.0%; CNX Resources, 5.8%; Fidelity National Information Services, 5.5%; Kellanova, 5.5%; IAC, 5.4%; MGM Resorts, 5.2%; Mattel, 4.8%; CNH Industrial, 4.7% and Bio-Rad, 4.2%. Fund holdings are subject to change, and holdings discussions are not recommendations to buy or sell any security. Current and future holdings are subject to risk. Funds distributed by ALPS Distributors, Inc. LLP001527 Expires 10/31/2024 |
Editor’s Note: The summary bullets for this article were chosen by Seeking Alpha editors.
Editor’s Note: This article discusses one or more securities that do not trade on a major U.S. exchange. Please be aware of the risks associated with these stocks.


