JHVEPhoto
Invesco Ltd. (NYSE:IVZ) ranks #20 in market size out of the ninety-two companies that make up the Asset Management and Custody Banks industry. As an asset manager, the firm generated $5.814 billion TTM revenue in Q2, but still maintains a negative net income of $100.4 million, partially due to an intangible asset impairment of $1.249 billion in Q4 ’23. Nonetheless, the net income achieved in Q2 was $191.4 million and had a margin of 12.90%.
In this analysis, I will go through Invesco’s fundamentals and valuation to decide whether this stock is a buy, sell, or hold.
Invesco: Mutual Funds Challenges, ETFs Opportunities
Invesco is the fourth largest U.S.-listed ETF issuer, with approximately 228 ETFs available. Out of those, the most popular one is, of course, the Invesco QQQ Trust ETF (QQQ), which alone has around $264 billion in assets under management and is the most liquid and largest ETF tracking the Nasdaq.
Although Invesco has a dominant market share in passive ETFs, they still concentrate most of their AUM on classical active strategies via mutual funds. As of Q2, AUM coming from active funds accumulated $988 billion compared to the $653 billion from passive strategies, and the difference expands further when analyzing the average long-term AUM. Yet, as expected, ETFs are the investment structure that by far has the most positive long-term net flows. On the other hand, fundamental equity seems to be slowly dying even with robust equity markets rising.
But there is a good reason for that. Over the last five years, only 39% of Invesco’s AUM invested in actively managed equities outperformed their underlying benchmarks. A number that is slightly better than the 31% from T. Rowe Price Group, Inc. (TROW), but it is still a poor performance that just gives investors more reasons to invest passively in equities. Contrary to fixed income where, Invesco’s funds have done extraordinary over the past five years, with 92% of the AUM outperforming the passive benchmarks.
IVZ 10-Q
IVZ: Revenue vs. AUM Growth Discrepancy
When observing Invesco’s income statement time series, the most obvious aspect is its stagnant top-line growth. For example, ten years ago, the firm achieved $5.147 billion in revenue, and now it’s at $5.814 billion, representing a slow CAGR of roughly 1.23%. Considering how much markets have gained over the past decade, this lackluster growth is a clear indication that the company is balancing between the maturing and declining business stages.
Contrarily, AUM growth has been different. In 2014, Invesco’s total AUM was $792.4 billion and now sits at $1,715.8 billion, which indicates an 8.03% CAGR. This divergence between AUM growth and revenue growth could be explained by the fact that active funds (which are declining in AUM growth), are far more profitable than passive funds, which have very cheap expense ratios. As a consequence of AUM shifting towards passive products, the amount of fees collected declines.
For example, the largest mutual fund that Invesco offers is the Invesco Developing Markets Fund A (ODMAX) with $19.36 billion in net assets. Thereafter, they charge an expense ratio of 1.26%. On the other hand, the Invesco QQQ Trust ETF has $262.4 billion in AUM but only charges 0.20%, which means that it takes 6.3x more inflows for QQQ to match the fees collected by ODMAX.
Invesco: Underperformance Analysis and Future Outlook

Over the past five years, Invesco together with the other asset managers with significant equity mutual funds exposure, have underperformed the market considerably. Invesco’s price return has been 10.76%, but -9.61% when removing the dividend contributions. On the other hand, BlackRock, with massive passive ETF exposure, has drastically diverged from the other active managers by appreciating roughly 119.20% when including dividends.
In my opinion, Invesco is a company whose ETFs are benefitting from secular tailwinds, but their mutual funds are exhibiting secular headwinds. Since the mutual fund exposure is higher, that’s weighing on the stock price and, therefore, the underperformance. Also, as commented, it takes far more inflows from passive products to equalize the fees received from active products, making it a hard situation for Invesco that is likely to persist in the future.
The performance of equity markets, for example, has been fantastic over the past decade. But what if this doesn’t continue and the market exhibits a lost decade? That would most likely pause ETF inflow growth and most likely would accelerate the negative net flows from classical mutual fund structures.
Invesco vs. T. Rowe Price, Franklin Resources, and BlackRock: Valuation Insights
|
IVZ |
TROW |
BEN |
BLK |
Median | |
| P/E GAAP (FWD) |
9.91 |
10.85 |
12.57 |
20.12 |
11.71 |
| EPS Growth Diluted (FWD) |
2.55% |
4.60% |
-9.62% |
9.56% |
3.58% |
Source: Seeking Alpha
When comparing Invesco with its most similar peers, T. Rowe Price, Franklin Resources, Inc. (BEN), and BlackRock, Inc. (BLK), it trades below all of them in terms of forward PE multiple. From there, there is a clear distinction between BLK versus TROW, BEN, and IVZ, as the market is valuing BlackRock with a forward multiple that is roughly twice the other names.
In my previous analyses, I mentioned how Franklin Resources and T. Rowe Price suffer from low industry growth due to their exposure to classic mutual fund structures. Although Invesco still has a considerable portion of its AUM in active mutual funds, the truth is that it holds a dominant position in passive funds. Still, the market even gives it a valuation that is inferior to BEN, which is a company that is severely struggling with growth.
In addition, IVZ’s forecasted EPS growth of 2.6% partly explains the cheaper valuation as it has growth that’s 3.7x lower than the one of BlackRock. On the other hand, BEN trading at 12.6x forward earnings is unjustifiable given their expected EPS growth, and therefore, I still maintain a strong sell rating on the stock.
Seeking Alpha, FinChat, Damodaran, Trading Economics, Yahoo Finance, IVZ 10-Q, Author’s Compilations
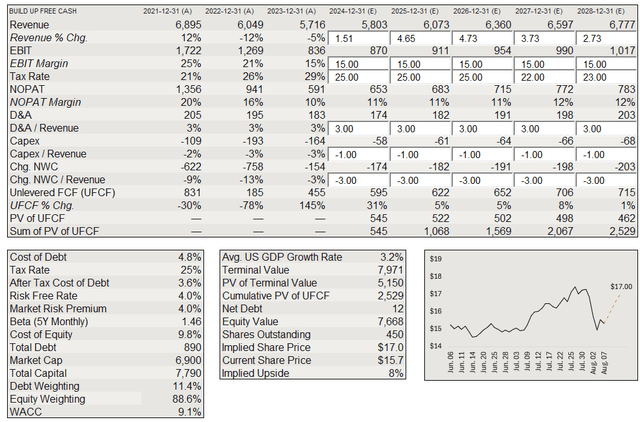
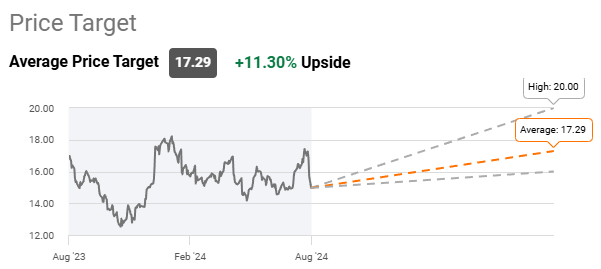
Now, based on a single-case discounted cash flow valuation, IVZ’s stock sits undervalued. With a terminal growth rate of 3.2%, WAAC of 9.1%, and further assumptions displayed above, the intrinsic value of Invesco is $17, which represents an 8% upside from a current share price of approximately $16. This valuation falls within the mid-range of Wall Street analysts’ price targets, where $17.29 is the average target and $20 is the highest target.
Seeking Alpha
Takeaway
Although Invesco is not like BEN who has a small ETF exposure, their out-of-fashion equity mutual funds will probably continue with AUM declines or growth deceleration for many years, and this would ultimately weigh on the stock. Even though their valuation sports as undervalued, in my opinion, they will continue to underperform the SPDR® S&P Capital Markets ETF (KCE) going forward. Making names such as BlackRock more attractive as they are not suffering from mutual fund headwinds and are primarily benefiting from the shift toward ETFs. Therefore, I rate Invesco with a sell rating despite having well-positioned products such as their Nasdaq tracking ETFs.


