

sankai
Table 1: Performance of the Aegis Value Fund as of December 31, 2024
|
Annualized |
||||||
|
Six Month |
One Year |
Three Year |
Five Year |
Ten Year |
Since Inception 5/15/98 |
|
|
Aegis Value Fund (MUTF:AVALX) |
6.16% |
9.43% |
11.01% |
17.46% |
13.51% |
10.99% |
|
S&P Sm. Cap 600 Pure Value Index ^ |
13.11% |
5.55% |
6.80% |
11.34% |
7.32% |
N/A |
|
8.44% |
25.02% |
8.94% |
14.53% |
13.10% |
8.44% |
|
|
Morningstar Percentile Ranking * |
46 |
5 |
2 |
1 |
||
|
Funds in Small Value Category |
448 |
437 |
431 |
399 |
| * Morningstar Percentile Ranking is based on total return.^ Available performance data for the S&P SmallCap 600 Pure Value Index prior to the December 16, 2005 inception date of this Index cannot be shown as display of pre-inception Index performance data is not permitted. Performance data quoted represents past performance and does not guarantee future results. Current performance may be lower or higher than the performance data quoted. The investment return and principal value will fluctuate so that upon redemption, an investor’s shares may be worth more or less than their original cost. The 30-Day Yield as of 2/20/2025 is 0.00%. For performance data current to the most recent month end, please call us at 800-528-3780 or visit our website at https://www.aegisfund.com. The Fund has an annualized gross expense ratio of 1.43% and a net annualized expense ratio, after fee waiver and/or expense reimbursement and management fee recoupment, of 1.46%. Under the waiver, the Advisor has contractually agreed to limit certain fees and/or reimburse certain of the Fund’s expenses through 4/30/2025. |
Dear Aegis Investors:
The Aegis Value Fund (AVALX) rose 6.16 percent in the second half of 2024 to close the year with a 9.43 percent gain, outperforming its primary small-cap deep value benchmark, the S&P SmallCap 600 Pure Value Index, which returned just 5.55 percent for the year. The Russell 2000 Value Index of small-cap value stocks climbed 8.05 percent while the mega-cap stocks were 2024’s big winners, powering the capitalization-weighted S&P 500 to an extraordinary annual gain of 25.02 percent. Although our Fund trailed the soaring S&P 500 in 2024, we continue to out-perform the S&P 500 over longer time-periods (including the past three years, five years, ten years and since its 1998 inception), while also significantly outpacing our primary deep-value benchmark, as seen in Table 1.
The “Magnificent Seven” dominated again in 2024
It was a challenging year to be a value investor as the Magnificent Seven mega-cap stocks continued to reign over the investment landscape in 2024. The US mega-caps surged once again into year-end as the Federal Reserve fueled the rally with a late-year dovish pivot, cutting short-term interest rates by nearly 100 basis points. Nvidia (NVDA) ended 171.2 percent higher on the year amid strong sentiment towards investment in artificial intelligence-related hardware, while Tesla (TSLA) shares surged 62.5 percent, spurred on by Trump’s election. META shares climbed 65 percent. Investors, fearful of missing out on further gains, continued to crowd into the soaring mega-cap stocks, leaving the rest of the market trailing well behind. Tellingly, the equal-weighted S&P 500, which mutes the returns of the soaring mega-caps, managing returns of just 11.1 percent, substantially underperforming the extraordinary return of the cap-weighted Index. Small-cap returns were also more subdued, with the Russell 2000 (RTY) delivering gains of just 11.54 percent, purportedly its worst showing against the S&P 500 since 1998.
Market breadth was the poorest in years, with little excitement outside of the large-cap technology stocks
With a few mega-caps driving the lion’s share of market gains, it was no surprise that market breadth was unusually poor in 2024, with Bank of America (BAC) reporting just 31 percent of stocks having outperformed the S&P 500, reportedly the lowest percentage since the Telecom Media Technology bubble in 1998 and 1999. Market breadth worsened significantly at year-end, reportedly hitting a 38-year record monthly low in December. Within the S&P 500, the tech equities dominated in 2024, with the S&P 500’s Communication Services and Technology Sector stocks soaring by 38.89 percent and 35.69 percent, respectively. On the flip side, Materials Sector and Energy Sector stocks, a large focus of our Fund, were among the laggards, dropping by 1.83 percent and gaining a paltry 2.31 percent respectively. Foreign stocks also trailed large-cap US stocks, with the S&P 500 outperforming the MSCI World Ex-US Index by the largest margin in more than 25 years as the dollar strengthened by 7 percent against world currencies. Dollar index (USDOLLAR, DXY) gains for the year were reportedly the strongest since 2015.
Aegis returns in 2024 were driven by Energy & Utilities Sector holdings
While the S&P 500’s Energy Sector stocks lagged amid a slight 0.1 percent drop in WTI Crude prices, the Fund’s Energy Sector holdings significantly outperformed their energy peers, delivering a substantial boost estimated at 6.33 percentage points to Fund returns. Most positively impacting performance was the Fund’s holdings of Natural Gas Services Group (NGS), which added 2.76 percentage points as shares climbed 67 percent. Investor sentiment toward the oil & gas compression rental company rapidly improved in 2024 on rising corporate cash flows as the large, high-return capital expenditures made in recent years to build-out its compressor rental fleet began to bear fruit. Aegis holdings in Nigerian oil & gas producer Seplat (SEPL-L) also delivered an estimated 0.98 percentage points to Fund returns. Seplat shares climbed 52 percent over the year as the company successfully closed on the transformational acquisition of Exxon’s (XOM) shallow water assets after several years of government negotiations. Seplat appears to have paid a reasonable price for the conventional, low-decline reserves and looks well positioned to rapidly grow production from these previously non-core and underinvested Exxon assets. Adams Energy (‘AE’), an oil products transportation company, also lifted Fund returns by 0.42 percentage points as it agreed to a take-out at $38, a 45 percent premium to the price at year-end 2023. Within the Utilities Sector, shares in the independent power producer Hallador Energy Company (HNRG) climbed 30 percent, positively impacting Fund performance by another 1.30 percentage points as investor sentiment toward the Midwest coal power producer improved amid growing fears of data-center demand-driven power shortages. Having acquired the one-Gigawatt Merom Power Station at a bargain price and a fraction of replacement cost from a utility company purging the asset to conform with the latest in ESG fashion, Hallador has nicely positioned itself for strong future shareholder returns while offering reliable and inexpensive power to the increasingly tight US power market.
Our biggest new position in 2024 was Canadian on-shore driller, Precision Drilling
The Fund’s largest purchase in 2023 was a new position in Precision Drilling (PDS, PD-TSE). The Canadian oil & gas land drilling company was purchased at an attractive market valuation of just 0.7 times tangible book value (well beneath asset replacement cost) and at less than five times 2024 free cash flow. Precision Drilling is a dominant player in the attractive Canadian market, with 78 rigs currently running there. We are optimistic about Canadian energy fundamentals, which we view as significantly stronger than implied by the current valuation. Oil service companies in western Canada, an area historically constrained by lack of oil & gas egress capacity, are today well-positioned to strongly benefit from improved pipeline takeaway infrastructure as Canada’s TMX Pipeline and its Shell (SHEL) LNG export project ramp-up. Precision also has 34 rigs running in the United States, a significant drop-off from early 2023 as gas price declines dampened activity in the Marcellus and the Haynesville. Increasing prospects of a much colder winter in North America this year have recently lifted natural gas prices, which could spur a rebound in Precision’s gas-drilling business. Longer-term, expected additional LNG export capacity additions in North America are constructive for additional medium-term gas drilling demand. Precision also has 8 rigs on long-term contracts at strong margins in the Middle East, which adds a measure of stability to the company’s cash flows. In recent years, cash generated in the company’s operations has been used to strengthen the balance sheet, with debt paydown expected to drop leverage to the company’s long-term target debt level of less than one turn of EBITDA by mid-2025, which should allow the company to accelerate shareholder returns to a planned 50 percent of free cash flow. In 2024, the company has already been allocating 25-30 percent of free cash flow to shareholder returns, primarily through accretive share repurchases, buying-in approximately four percent of its shares. The Fund’s position in Precision Drilling comprised 2.2 percent of Fund assets at year-end.
The Fund’s Materials Sector positions also delivered Fund gains overall in 2024, despite a few troubled holdings
The Fund’s Materials Sector stocks, comprising approximately one-half of overall Fund assets, also outperformed returns of the S&P 500 Materials Sector, delivering gains that in aggregate bolstered 2024 Fund returns by an estimated 2.20 percentage points. However, within this sector, we had a number of troubled investments that experienced declines for the year. Most negatively impacting Fund performance was our position in North American lumber producer Interfor (OTCPK:IFSPF, IFP-TSE), which dropped 34 percent over the year, negatively impacting the Fund by 1.63 percentage points. The North American lumber industry, after experiencing a period of extraordinary profits amid soaring lumber prices in 2021 and 2022, has been suffering in the last couple years. Soaring mortgage rates and satiated home-improvement consumers have dampened housing construction and home-improvement-related lumber demand, driving lumber prices to sub-breakeven levels. As a result, Interfor’s balance sheet has been deteriorating amid negative operating cash flows following the company’s ill-considered, debt-financed acquisition of the EACOM Timber Corporation, a high-quality lumber operation for which Interfor paid top-dollar in early 2022. Despite the financial pressure, Interfor maintains strong liquidity and remains highly leveraged to and well positioned to benefit from any recovery in lumber demand. Furthermore, despite the overpriced acquisition, the company continues to trade at a significant discount against both book value and our estimates of asset replacement cost. Nevertheless, we have grown increasingly concerned over the growing debt burden carried by the company, which has made the investment thesis more time-sensitive and binary than we had originally anticipated. As a result, we sized the position down. Interfor comprised 2.7 percent of Fund assets at year-end. Our Gold Mining positions were up overall, but struggles at Minera Alamos and Orezone muted our returns
Fund performance in 2024 benefited by an estimated 2.12 percentage points from nearly two dozen precious metals mining positions, which represented just under a quarter of Fund assets and approximately half of our Materials Sector investments at year-end. In aggregate, these positions, while delivering positive results, underperformed the MVIS Global Junior Gold Miners Index, which returned 15.71 percent on the back of a blistering 27.22 percent increase in the gold price. Fortunately, several Aegis mining positions were up more than 80 percent on the year, including Catalyst Metals (CTYMF, CYL-AUS), Goldquest Mining (OTCPK:GDQMF, GQC-TSX), Newcore (OTCQX:NCAUF, NCAU-TSX), and G Mining (OTCPK:GMINF, GMIN-TSE) which together added 2.92 percentage points to Fund returns. Our largest purchase in the first half of the year, African mid-tier gold producer Perseus Mining (PMNXF, PRU-AX), also boosted the Fund by another 0.75 percentage points as share prices climbed post purchase.
However, two sizable Fund gold mining positions, Minera Alamos (OTCQX:MAIFF, MAI-TSX) and Orezone (OTCQX:ORZCF, ORE-TSX), both encountered difficulties in 2024 which together negatively impacted the Fund by 1.73 percentage points. In both situations, the culprit has been the political climate. In the case of Minera, which specializes in the development of mines with low capital intensity, investor sentiment towards mining in Mexico soured as the previous leftist Amlo government delayed the issuance of many critical mining permits to the industry. Permit delays forced Minera to delay the build and start-up of its highly economic Cerro de Oro development and hindered the expansion of its small, currently-producing Santana mine. Fortunately, following an election in 2024, Claudia Sheinbaum has now replaced Amlo as President. The industry is growing increasingly optimistic that Sheinbaum, considered to be a more pragmatic leader than Amlo, will resume issuing permits and approvals. While the approval of the application for Minera’s Cerro de Oro project would dramatically improve fundamentals at the company, management is not standing still. Minera is scheduled to soon close on the purchase of the Copperstone project, a largely permitted mine in Arizona that the company contends it will quickly and economically bring into production, substantially diversifying the company’s asset base. We also continue to hold shares of Orezone, the gold producer in troubled Burkina Faso highlighted in our previous letter covering the first half of 2024. While Burkina Faso headline risk continues to dampen investor sentiment, operations at the company have quietly improved. Orezone’s sulfide expansion project is performing on-budget and on-schedule, which should enable the company to increase its production by approximately 50 percent by early 2026, driving free cash-flow yields to above 30 percent at today’s prevailing gold prices and market valuation. We continue to hold our positions in both Minera Alamos and Orezone, representing 1.97 and 2.13 percent, respectively, of Fund year-end assets, and anticipate recoveries.
The US equity markets in general appear top-heavy, speculatively priced, and substantially overvalued
Today, speculative fervor continues to dominate the markets. The ratio of assets in levered long ETFs to assets in short ETFs hit 11.1 times, the most on record according to Bloomberg. Fund Manager Survey cash allocations are at the lowest since 2001 according to Bank of America. Retail sentiment is also unusually robust with Households all-in on equities. Ned Davis Research recently reported that stocks as a percentage of total household financial assets hit 36.1 percent, the highest household allocation to equities since 1952. NYSE margin debt is also on the rise, climbing nearly 50 percent in the last two years to levels near $900 billion today.
Table 2: US equity market valuation multiples are at historically expensive levels
|
Aggregate Index |
Median Stock |
|||
|
Metrics |
Current |
Historical Percentile |
Current |
Historical Percentile |
|
EV / Sales |
3.4 |
100% |
3.5 |
97% |
|
Cashflow Yield (‘CFO’) |
5.1% |
100% |
5.80% |
95% |
|
Price / Book* |
5.3 |
99% |
3.7 |
98% |
|
EV / Ebitda* |
16.5 |
97% |
13.8 |
94% |
|
Forward P/E |
22.3 |
95% |
19.2 |
95% |
|
Cyclically Adjusted P/E |
34.3 |
96% |
N/A |
N/A |
|
Free Cash Flow Yield |
2.9% |
77% |
3.60% |
63% |
|
Median Absolute Metric |
97% |
95% |
||
|
* Data since 1987 (Data since 1976 unless otherwise noted) Source: Compustat, Goldman Sachs Global Investment Research |
Figure 3: High P/E multiples are strongly correlated with lower forward 10-year returns
Source: Bloomberg (S&P 500 Monthly Data from 1957-2024)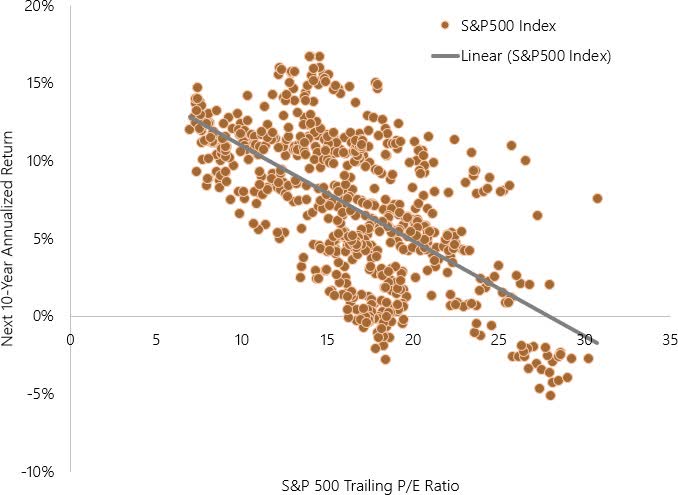
US equities today are top-heavy, fully-valued, and vulnerable to decline. The market capitalization of the top-10 stocks in the S&P 500 Index at year-end constituted nearly 40 percent of the overall index, with the largest market-cap stock at a record valuation 750 times as large as the 75th percentile stock in the Index, a concentration level not seen since the 1930s, according to Goldman Sachs. Additionally, as can be seen in Table 2, the aggregate valuation multiples of the US equity market are also stretched to the highest levels in several decades, with Enterprise Value to Sales multiples and Cash Flow Yields actually in the 100th most expensive percentile historically. The market’s Price-to-book multiple is at the highest point since March 2000 at the peak of the Dotcom Bubble. The S&P 500’s forward P/E of 22.3 times is in the 95th percentile going back to 1976 and is reportedly at the second most expensive valuation going back 25 years. The S&P 500 Cape Shiller Index of Price-to-ten-year average earnings is now at the second highest level of all-time, just behind valuation at the peak of the Dotcom bubble in early 2000. The trailing P/E of the S&P 500 is now at a hefty 24.7 times, with the trailing P/E of the largest 10 companies in the Index trading at substantially higher levels. And while it is true that there has been strong recent earnings growth in the mega-caps of the S&P 500 over the last year, the high multiples seen today already incorporate the persistent continuation of recent robust earnings growth rates many years into the future. Meeting these lofty earnings growth expectations embedded in the valuation will likely prove to be a substantial future challenge. In short, we suspect investor disappointment is likely in the cards. As can be seen in Figure 3, since 1957, historically high forward P/E multiples have been historically well-correlated with substantially lower ten-year future returns. Should these historic correlations hold, annualized return expectations for the US Equity markets over the next ten years based-on today’s P/E multiple are predicted to be poor.
US equity valuations roared higher in unusual defiance of sharply higher interest rates
The S&P 500’s lofty valuation multiples also appear to be defying the gravitational pull of higher interest rates. In the months since the Federal Reserve made its dovish pivot in September and began lowering short-term rates, ten-year Treasury yields have been uncooperatively on the rise, surging nearly 100 basis points. As a result, today, the yield on the ten-year Treasury now exceeds the S&P 500’s forward earnings yield by the largest amount in 23 years. Historically, as seen in Figure 4, the S&P 500 earnings yield has averaged 250 basis points higher than the ten-year Treasury. At today’s ten-year Treasury yield of 4.53 percent, applying this 250 basis point premium would imply a forward S&P 500 earnings yield of approximately 7.0 percent, or an S&P 500 multiple of approximately 14 times forward earnings. A sharp decline in the S&P 500 to 14 times earnings from today’s 22.3 times earnings suggests the possibility of a nearly 40 percent decline in the S&P 500. Clearly US equities appear vulnerable today.
Yet cash and equivalents today may not offer the “safe haven” of past years
Navigating through markets has never been an easy task, but the current environment poses particularly difficult challenge. Historically, when equity markets were overvalued, shifting assets into cash equivalents such as short-term Treasuries and high-grade bonds would act to mitigate the risk of losing money if equities declined. Today, however, the environment appears to be quite different, as the performance of dollar-denominated Treasuries and high-grade bonds in real terms under a scenario of market stress is highly dependent on how the Federal Reserve may choose to respond.
In recent years, when markets experienced turmoil, the Federal Reserve historically engaged in increasingly aggressive monetary stimulus. While the Fed got away with this for some time, in 2020, when monetary conditions were loosened in response to Covid, one of the biggest inflationary surges in decades occurred, requiring a hefty resetting of interest rates to higher levels. Inflation today, while having cooled from peak levels, has remained stubbornly high, despite the Fed’s higher rates.
Figure 4: Differences in Earning Yields: S&P 500 Vs 10 Yr. Treasury
Source: Bloomberg (Data from 12/15/2000 to 12/31/2024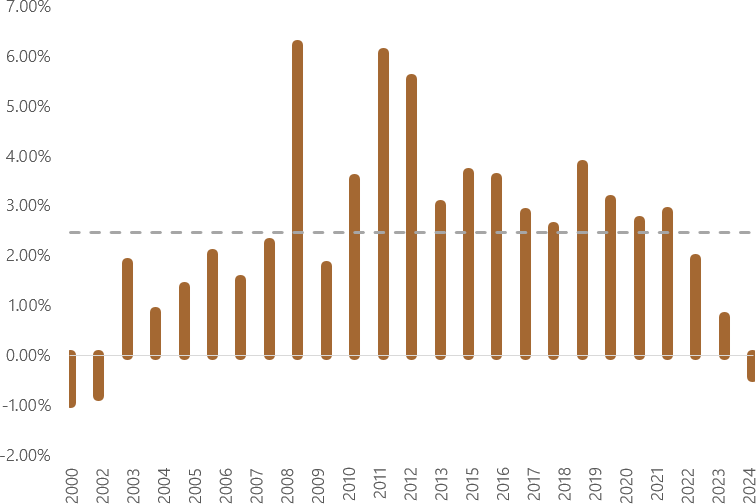
Interestingly, even though inflation has failed return to its two percent target, the Fed inexplicably initiated a new series of rate cuts in September. We suspect the Fed has grown increasingly concerned about the impact of surging interest payments on the Federal Government’s $36 trillion of ever-growing debt outstanding. While it is certain possible that inflationary pressures will abate, there also exists a meaningful possibility that inflation will resurge, perhaps requiring even higher interest rates by the Fed to bring it under control. Scenarios of market declines amid higher inflation occurred in the 1970s and are clearly a possibility today, perhaps catalyzed by increased tariffs and other supply constricting geopolitical events. Under such scenarios, should the Fed choose to raise rates to battle any resurgent inflation, we would expect significant Federal Government budgetary strain. Furthermore, certain sectors of the private economy with substantial financial leverage, including real-estate and private equity would likely come under severe financial pressure.
Should inflation resurge, however, we would expect the Federal Reserve to come under immense pressure, political and otherwise to abandon its vigilance against inflation in favor of helping to fund the Federal Government and perhaps relieve the strain of higher rates on politically connected borrowers. Material devaluation of the dollar through additional inflationary Fed intervention is a distinct possible outcome with the potential to badly erode the purchasing power of holders of Treasuries and high-grade bonds. With the Federal Government continuing to engage in massive levels of fiscal deficit spending, running peacetime deficits at a whopping six percent of GDP, we suspect the outcome of eventual inflationary Fed monetization is rapidly growing in probability. Clearly, in such a scenario of Fed-driven debt monetization, dollar-denominated high-grade bonds and cash-equivalents would lose immense purchasing power, no longer providing the “safe-haven” they have proven to be in the recent past.
We believe our angular portfolio, with a strong focus on materials and energy, is well positioned given today’s environment
We are currently maintaining a portfolio that is unusually angular, with high concentration among a number of deeply undervalued small-cap energy and materials stocks from the value universe, including a substantial number of Canadian stocks and a few other foreign equities. Many of these Fund positions have been performing well despite the significant headwinds of a rapidly strengthening dollar. However, with the dollar hitting new highs, sentiment towards securities trading outside the United States has deteriorated markedly. Resultingly, significantly lower valuations remain available on foreign securities. With the strong dollar now looking quite extended, and with US technology equities today in the spotlight, we believe it is a great time to be opportunistically positioned in international, commodity-producing stocks, particularly given that commodities are typically priced in dollars. Should the dollar roll-over, whether driven by a new Washington political consensus or otherwise, the recent dollar headwinds faced by international stocks and commodity producers could rapidly shift to tailwinds.
Figure 5: Aegis Value Fund, Russell 2000 Value, and S&P 500 Index Historical Price-to-Book
Source: Aegis Financial Corp and Bloomberg (Data from 9/30/1998 to 12/31/2024)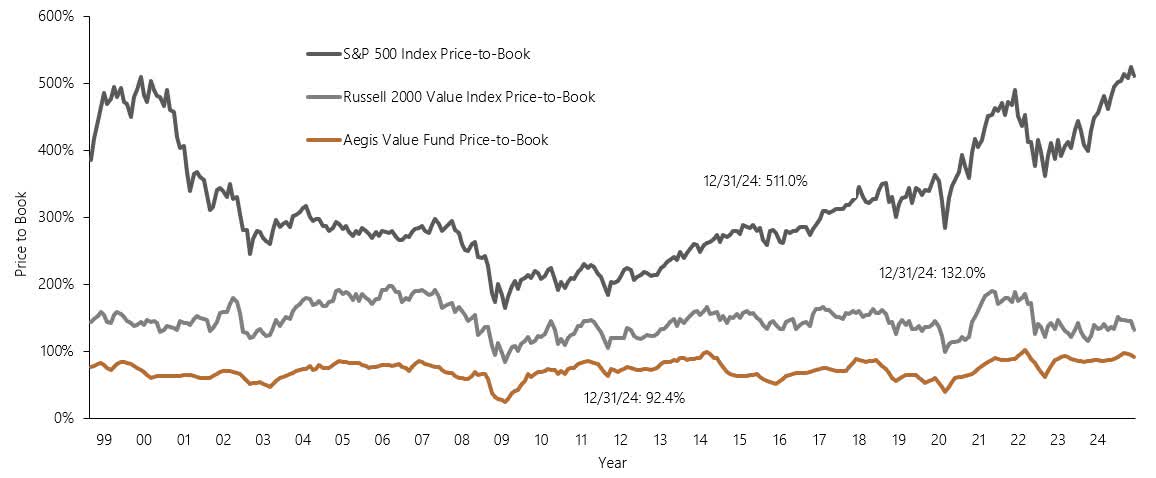
As the S&P 500 has soared in the last few years, US small caps have also been underperforming, with many managers appearing to be throwing in the towel. Fund manager positioning toward small-cap stocks was recently reported by Bank of America to be at the lowest level in records going back to 2015. As seen by Figure 5, the Russell 2000 Value Index of small value stocks trades today near one of the biggest discounts to the S&P 500 on price-to-book in 25 years. Furthermore, with the Energy and Materials Sectors having also substantially underperformed the S&P 500 in 2024, investor sentiment towards these areas in particular remains remarkably low, with Bank of America also recently reporting that long-only exposure to Energy and Materials Sector stocks at the lowest weighting relative to that of the S&P 500 Index in data going back as far as 2008. As a result of the poor investor sentiment, we are currently observing a lot of value in the materials stocks and believe it is a good time to be heavily positioned in these names.
Today, Energy Sector stocks provide some of the highest free cash flow yields in the entire market and moreover give investors some of the highest overall shareholder return yields (dividends plus buybacks) available in the entire market. While some may fret about the possibility of a global economic downturn and near-term exposure to oil & gas price volatility, we take comfort in the massive unrecognized deleveraging many of these companies have achieved over the last several years, which has substantially strengthened energy company balance sheets. We also recognize the compelling math of the long-standing, historic per-capita energy consumption trends driven by the voracious growth in fossil fuel use from the world’s developing economies. Furthermore, we suspect meeting the world’s future fossil fuel demand will prove far more challenging than is conventionally understood as US unconventional shale oil production has been leveling-off rapidly after more than a decade of enormous growth.
Importantly, Energy and Material Sector stocks were among the strongest performers in the inflationary 1970s. Furthermore, while we believe our precious metals mining holdings have excellent current fundamentals, delivering strong cashflow at today’s gold prices, these holdings also position the Fund to deliver extraordinary returns should scenarios of inflationary surge amid Federal Reserve complacency materialize.
Our holdings trade at inexpensive valuations, particularly relative to the market
Overall, as also seen in Figure 5, stocks in the Aegis Value Fund trade at approximately a fifth the valuation of the S&P500 on a price-to-book basis. We are working diligently to ensure that the Fund is invested in a portfolio of stocks offering the best risk/return profiles available to investors in the markets today. Furthermore, we believe our portfolio is set up to deliver strong returns despite US equity markets that appear far from undervalued. Aegis employees and our families have in excess of $50 million of investment in the Aegis Value Fund. We continue to carefully monitor the portfolio and investment landscape for emerging risks and opportunities. Should you have any questions, our shareholder representatives are available at (800) 528-3780. You are also welcome to call me personally at (571) 250-0051.
Sincerely,
Scott L. Barbee,
Portfolio Manager,
Aegis Value Fund
|
Please see the following page for important information. Must be preceded or accompanied by a prospectus. The Aegis Value Fund is offered by prospectus only. Investors should carefully consider the investment objectives, risks, charges and expenses of the fund. The Statutory and Summary Prospectuses contain this and other information about the Fund and should be read carefully before investing. To obtain a copy of the Fund’s Prospectus please call 1- 800-8-3780 or visit our website aegisfunds.com, where an on-line version is available. Mutual fund investing involves risk. Principal loss is possible. Investments in foreign securities involve greater volatility and political, economic and currency risks and differences in accounting methods. Investments in smaller and mid-cap companies involve additional risks such as limited liquidity and greater volatility. Investment concentration in a particular sector involves risk of greater volatility and principal loss. Value stocks may fall out of favor with investors and underperform growth stocks during given periods. The Fund’s top ten holdings are Hallador Energy Company, International Petroleum Corp., Amerigo Resources Ltd., Natural Gas Services Group, Kenmare Resources, Bank of Cyprus Holdings, Algoma Steel Group Inc., MEG Energy Corp., Capital Ltd., and Equi- nox ld Corp. As of December 31, 2024, the stocks represent 6.6%, 6.5%, 5.9%, 5.3%, 4.7%, 4.5%, 4.1%, 4.1%, 3.8%, and 3.6%, of total Fund assets respectively. Fund holdings are subject to change and should not be considered a recommendation to buy or sell a security. Current and future portfolio holdings are subject to risk. Morningstar Rankings represent a fund’s total-return percentile rank relative to all funds that have the same Morningstar Category. The highest percentile rank is 1 and the lowest is 100. It is based on Morningstar total return, which includes both income and capital gains or losses and is not adjusted for sales charges or redemption fees. © 2024 Morningstar, Inc. All rights reserved. The information contained herein: (1) is proprietary to Morningstar and/or its content providers; (2) may not be copied or distributed; and (3) is not warranted to be accurate, complete, or timely. Neither Morningstar nor its content providers are responsible for any damages or losses arising from any use of this information. Past performance is no guarantee of future results. Price to Book: A ratio used to compare a stock’s market value to its book value. It is calculated by dividing the current closing price of the stock by the latest quarter’s book value per share. Book Value: A company’s common stock equity as it appears on a balance sheet. Price-to-Earnings The P/E ratio is the measure of the share price relative to the annualized net income earned by the firm per share. S&P 500 Index: An index of 500 stocks chosen for market size, liquidity and industry grouping, among other factors. The S&P 500 is designed to be a leading indicator of U.S. equities and is meant to reflect the risk/return characteristics of the large cap universe. Cash Flow: A revenue or expense stream that changes a cash account over a given period. MVIS Global Junior Gold Miners Index: The modified market cap-weighted index tracks the performance of the most liquid junior companies in the global gold and silver mining industry. The S&P SmallCap 600 Pure Value Index: An index maintained and selected by the S&P Index Committee. It contains companies with market caps in the range of US$ 300 million up to US$1.4 billion and with public floats of at least 50% and with strong value characteristics. Russell 2000 Value Index: measures the performance of small-cap value segment of the U.S. equity universe. It includes those Russell 2000 Index companies with lower price-to-book ratios and lower forecasted growth values. Tangible Book Value: The net asset value of a company, calculated by total assets minus intangible assets (patents, goodwill) and liabilities. WTI: West Texas Intermediate is a grade of crude oil used as a benchmark in oil pricing. S&P 500 Energy Sector comprises those companies included in the S&P 500 that are classifieds members of the GICS® energy sector. EV (Enterprise Value): Company market capitalization plus debt, less cash. EBITDA: Earnings before interest, taxes, depreciation, and amortization expenses. The Russell 2000 Index: measures the performance of the small-cap segment of the U.S. equity universe and is constructed to provide a comprehensive and unbiased small-cap barometer. The Russell 2000 Index is a subset of the Russell 3000 Index representing approximately 10% of the total market capitalization of that index. It includes approximately 2000 of the smallest securities based on a combination of their market cap and current index membership. EV/Sales (Enterprise value/sales): a financial ratio that compares the total value (as measured by enterprise value) of the company to its sales. The MSCI World ex USA Index: A stock market index that tracks the performance of large and mid-cap companies in 22 developed markets, excluding the United States. S&P 500 Materials Sector comprises those companies included in the S&P 500 that are classified as members of the GICS® materials sector. The S&P 500 Shiller CAPE Ratio, or Cyclically Adjusted Price-Earnings ratio: A metric that compares the current price of the S&P 500 to its average earnings over the past 10 years. It’s also known as the Shiller P/E ratio. ESG (Environmental, Social and Governance): A set of standards for a company’s operations that socially conscious investors use to screen potential investments. The Magnificent Seven: The term refers to a group of seven large, influential, and high-performing US tech companies. They are Apple, Amazon, Alphabet, Meta, Microsoft, Nvidia and Tesla. Diversification does not guarantee a profit or protect from loss in a declining market. An investment cannot be made directly in an index. Earnings growth is not representative of the Fund’s future performance. Dividends are not guaranteed and may fluctuate. Opinions expressed are subject to change at any time, are not guaranteed and should not be considered investment advice. References to other investment products should not be interpreted as an offer of these securities. Quasar Distributors, LLC is the distributor for the Aegis Value Fund. |
Editor’s Note: The summary bullets for this article were chosen by Seeking Alpha editors.
Editor’s Note: This article discusses one or more securities that do not trade on a major U.S. exchange. Please be aware of the risks associated with these stocks.