

Key Insights
-
Institutions’ substantial holdings in Cooper Energy implies that they have significant influence over the company’s share price
-
The top 10 shareholders own 51% of the company
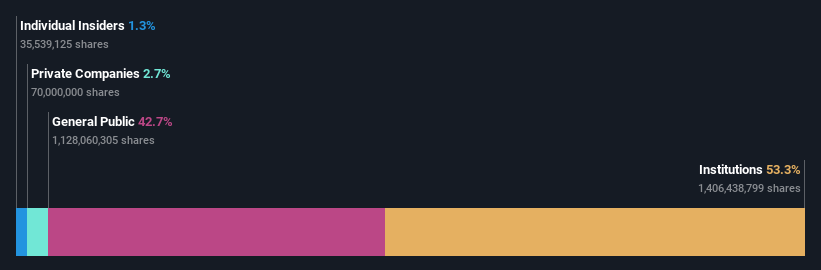
If you want to know who really controls Cooper Energy Limited (ASX:COE), then you’ll have to look at the makeup of its share registry. We can see that institutions own the lion’s share in the company with 53% ownership. Put another way, the group faces the maximum upside potential (or downside risk).
Given the vast amount of money and research capacities at their disposal, institutional ownership tends to carry a lot of weight, especially with individual investors. Hence, having a considerable amount of institutional money invested in a company is often regarded as a desirable trait.
In the chart below, we zoom in on the different ownership groups of Cooper Energy.
View our latest analysis for Cooper Energy
What Does The Institutional Ownership Tell Us About Cooper Energy?
Institutions typically measure themselves against a benchmark when reporting to their own investors, so they often become more enthusiastic about a stock once it’s included in a major index. We would expect most companies to have some institutions on the register, especially if they are growing.
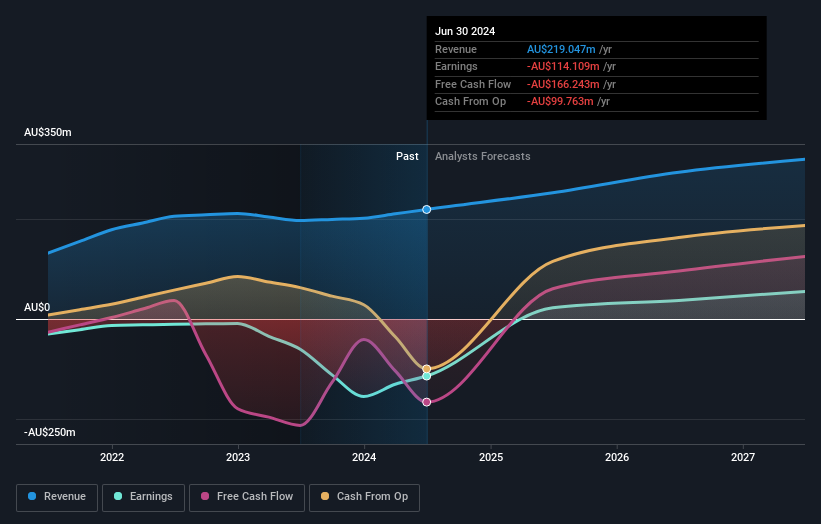
We can see that Cooper Energy does have institutional investors; and they hold a good portion of the company’s stock. This implies the analysts working for those institutions have looked at the stock and they like it. But just like anyone else, they could be wrong. It is not uncommon to see a big share price drop if two large institutional investors try to sell out of a stock at the same time. So it is worth checking the past earnings trajectory of Cooper Energy, (below). Of course, keep in mind that there are other factors to consider, too.
Investors should note that institutions actually own more than half the company, so they can collectively wield significant power. We note that hedge funds don’t have a meaningful investment in Cooper Energy. L1 Capital Pty. Limited is currently the largest shareholder, with 16% of shares outstanding. For context, the second largest shareholder holds about 6.7% of the shares outstanding, followed by an ownership of 5.1% by the third-largest shareholder.
We also observed that the top 10 shareholders account for more than half of the share register, with a few smaller shareholders to balance the interests of the larger ones to a certain extent.
While it makes sense to study institutional ownership data for a company, it also makes sense to study analyst sentiments to know which way the wind is blowing. Quite a few analysts cover the stock, so you could look into forecast growth quite easily.
Insider Ownership Of Cooper Energy
The definition of company insiders can be subjective and does vary between jurisdictions. Our data reflects individual insiders, capturing board members at the very least. Company management run the business, but the CEO will answer to the board, even if he or she is a member of it.
Insider ownership is positive when it signals leadership are thinking like the true owners of the company. However, high insider ownership can also give immense power to a small group within the company. This can be negative in some circumstances.
We can report that insiders do own shares in Cooper Energy Limited. As individuals, the insiders collectively own AU$7.3m worth of the AU$541m company. This shows at least some alignment. You can click here to see if those insiders have been buying or selling.
General Public Ownership
The general public, who are usually individual investors, hold a 43% stake in Cooper Energy. While this group can’t necessarily call the shots, it can certainly have a real influence on how the company is run.
Next Steps:
I find it very interesting to look at who exactly owns a company. But to truly gain insight, we need to consider other information, too. To that end, you should be aware of the 1 warning sign we’ve spotted with Cooper Energy .
Ultimately the future is most important. You can access this free report on analyst forecasts for the company.
NB: Figures in this article are calculated using data from the last twelve months, which refer to the 12-month period ending on the last date of the month the financial statement is dated. This may not be consistent with full year annual report figures.
Have feedback on this article? Concerned about the content? Get in touch with us directly. Alternatively, email editorial-team (at) simplywallst.com.
This article by Simply Wall St is general in nature. We provide commentary based on historical data and analyst forecasts only using an unbiased methodology and our articles are not intended to be financial advice. It does not constitute a recommendation to buy or sell any stock, and does not take account of your objectives, or your financial situation. We aim to bring you long-term focused analysis driven by fundamental data. Note that our analysis may not factor in the latest price-sensitive company announcements or qualitative material. Simply Wall St has no position in any stocks mentioned.